Galaxies for Fun Astronomical CCD photos on peculiar galaxies and other astronomical stuff.
www.galaxies.se - by Ivar Hamberg
Below are some spectrograms from the 70s, when I did some tests of taking spectra:


Astronomical Spectra:
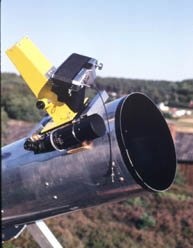
Some years ago, in the mid 70's, I built two spectrographs for taking astronomical spectra. The first one utilized a homemade liquid prism for dispersion. It worked quite well, and by changing the liquid, I got different dispersions to work with. Later on I built a more compact unit, where I used either a reflection grating or a glass prism. The grating had 1200 lines/mm, and gave a higher degree of dispersion than the prism. For the Sun and Moon and the very brightest stars, I used the grating. For less bright objects, the grating was exchanged for the prism.
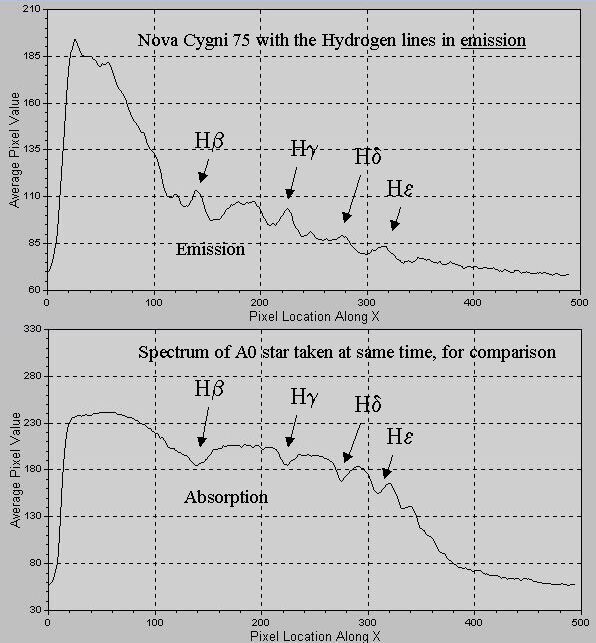
I was lucky to observe an exploding nova in Cygnus in early September1975, NOVA Cygni or V1500 Cygni. At that time I only had my first primitive spectrograph, but I managed to take a spectrum with visible emission lines from the quickly expanding outer shells of the nova. See below.
Spectrum of VEGA: VEGA is a typical A0 star with distinct absorption lines of hydrogen, the Balmer series. Imaged with prism. 1978-08-20.


Spectrum of NOVA Cygni, 1975: Although the spectrum is somewhat faint, one can easily see the emission lines from the quickly expanding gas. This spectrum was taken with my first bulky spectrograph, with a liquid prism. Taken in the beginning of September 1975. Great fun!

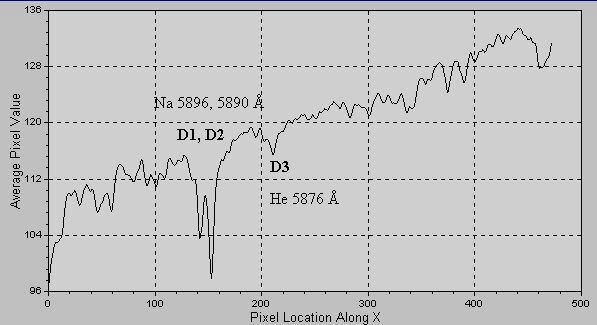
Solar spectrum (part I) taken with the astronomical spectrograph: This is the red to green part of the solar spectrum. The intensity curve shows a magnification of the Sodium lines at 5896 and 5890 Angstrom. A grating is utilized. The resolution is limited for this image, since the equipment is set for stars and not the sun. It shows the instruments resolution capability for imaging the much fainter stars. The separation between the Sodium lines is about 6 Angstrom.

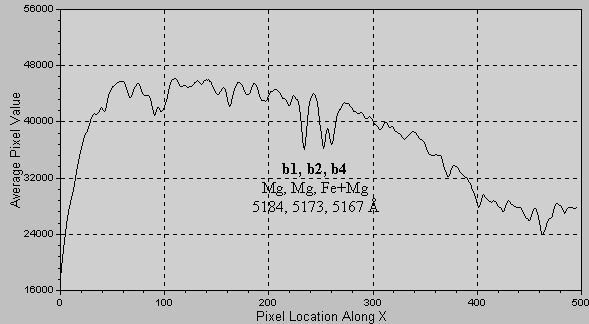
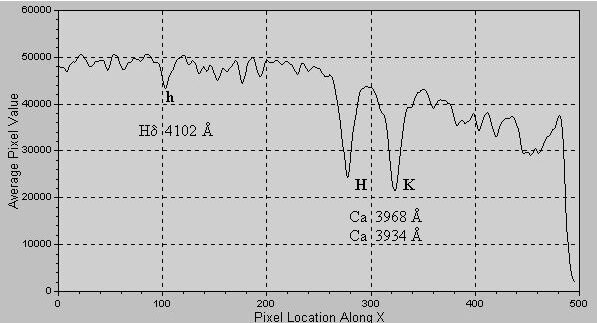
Solar spectrum (part II) taken with the astronomical spectrograph: This is the green to violet part of the solar spectrum. The intensity curves show a magnification of the Magnesium and Iron lines around 5167 Å, as well as the very prominent Ca lines at 3968 and 3934 Angstroms. Again, it is taken with a grating installed in the spectrograph.